Infographics


General

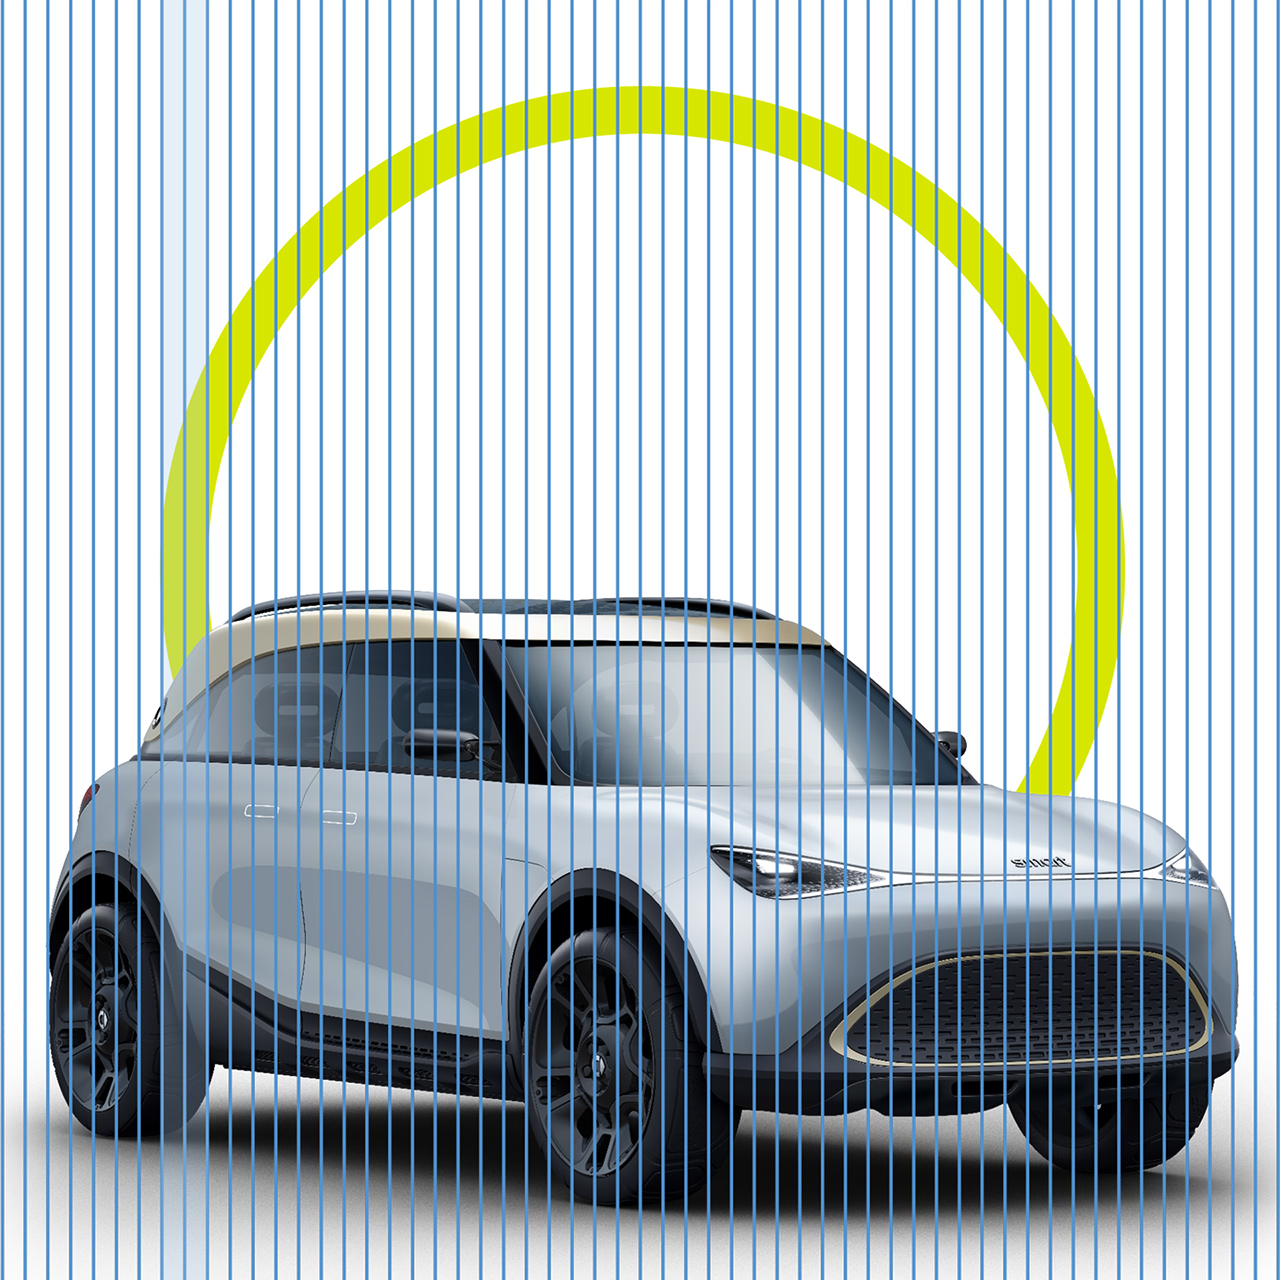
Infographics explain topics with a low level of complexity. They can use icons, lines, typography, and CGI to support the desired communication objective. The style of smart infographics is linear, clear, bold and informal.
Our infographics match the smart iconography. Colors, shapes, and the number of elements are limited to provide a clean and modern look. They can use icons, lines, typography, and CGI to get the information across.


Colors

The infographics mainly use primary colors. In exceptional cases, such as PowerPoint and in extremely complex graphics, the secondary colors can also be used. The use of colors can be related to the adaptation of UI elements and should therefore be understood as a recommendation. Deviations are possible.


Typography

Clear typography is necessary to convey information easily. FOR smart next is used in all infographics that require text. Legends, labels and other information that are not visual design elements are used in the FOR smart sans. 


Imagery

CGI motifs of smart cars and elements of our iconography can be used for infographics. CGI cars and icons can be combined, if necessary.


Grid & Structure

Our infographics use bold strokes for framing or conveying information. The line weight is defined by using a linear grid. The grid is divided into 56 units vertically. The vertical position of objects shown in the infographics is flexible.


Three different line weights based on a graphic width of 60 mm:


Standard line strengths:

Standard elements: medium lines. 

2 units = 2.14 mm (6.075 pt ≈ 6 pt) 


Standard line strengths:

Amending elements: thin lines. 

1 unit = 1.071 mm (3.036 pt ≈ 3 pt) 

Highlighting elements: bold lines. 

3 units = 3.214 mm (9.111 pt ≈ 9 pt)